Analytics Weekly Highlights | 2025-W30
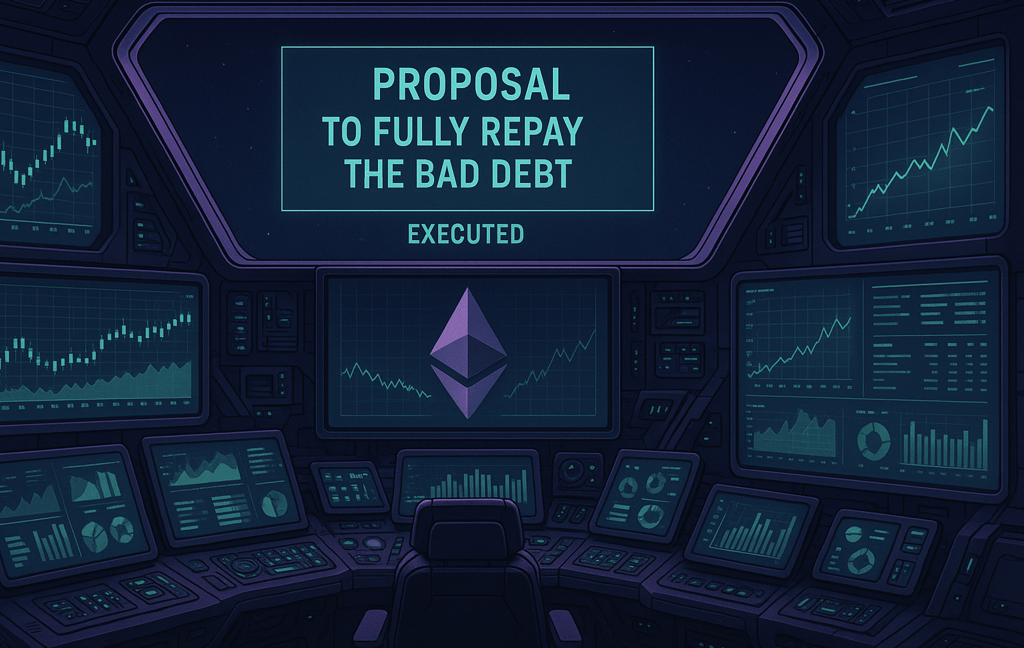
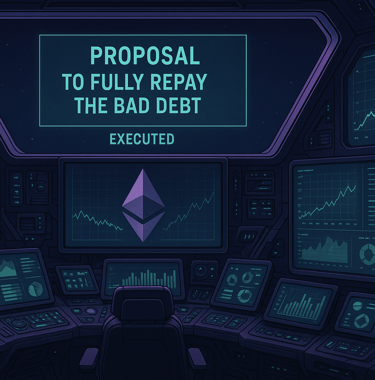
Hi Invader, and welcome to the Analytics Weekly Highlights for Week 30 of 2025. This week notably features the execution of the proposal to repay the DOLA bad debt.
____________________________________________
Supply & Market Capitalisation
In week 30 we observe a sharp increase of the price and market capitalization together with the circulating supply due to the latest proposal for settling the protocol's DOLA bad debt :
INV FDV USD: 30,133,290 (+23.54%)
INV Circulating Supply USD: 29,368,259 (+24.09%)
INV Circulating: 700,746 (+17.43%)
____________________________________________
DOLA Feds
DOLA Feds
This week there were a few changes in the total DOLA supply with a 2.2M expansion on FiRM markets bringing the total supply above the 210M mark :
Total DOLA Supply: 210,335,415 DOLA (+1.01%)
____________________________________________
FiRM
Usage
FiRM user numbers displaylittle changes over week 29.
Borrowers: 94 (+1)
Stakers: 116 (-2)
Active Users: 201 (steady)
Markets
FiRM markets TVL and current borrows are displaying a steep increase in week 30 tight to large deposits on INV (+4.9M), PT-sUSDE-25SEP2025 (+2.5M) and DOLA/USR (+2M) markets. For the first time current borrows on FiRM are over the 100M mark !
TVL : 149,846,715 USD (+8.19%)
Current Borrows : 102,572,452 (+5.60%)
This week we spotted 4 transactions over the million and many more above the 100k marks, mainly on the above mentioned markets.
👉🏾 To see the full list , scroll below this section.
DBR
This week the DBR burning mechanism has been very active with more than 1.6 million DBR burned :
Burned: 2,608,039 DBR
Total Burned: 62,610,848 DBR (Change: +4.17%)
____________________________________________
sDOLA
At the end of Week 30 sDOLA deposits cool of right above 25M :
Total deposits : 25,610,520 DOLA (-2.79 %)
____________________________________________
sINV
In Week 29 sINV deposits see a colossal increase :
Total deposits : 125,269 INV (+509.91%)
____________________________________________
DBR Virtual Auction
This week the DBR auction was very active :
Total DOLA bougth : 3,505,783 DOLA (+162,315 DOLA / +4.85%)
Total DBR sold : 41,060,668 DBR (+1,802,939 / +4.59%)
____________________________________________
DOLA Liquidity Pools
On the LP front, we observe little changes in both DOLA and other assets over week 30 :
DOLA in LPs: 77,056,034 DOLA (+1.91%)
Other Assets in LPs: 43,601,268 USD (-0.79%)
DOLA/Other Assets Ratio: 176.73% (Change: +4.56 pp)
The largest changed were :
DOLA-sUSDe increase by USD 0.8 millions to USD 45.5 millions (+1.83%)
sDOLA-scrvUSD decrease by USD 0.8 millions to USD 3.8 millions (-17.73%)
More exhaustive figures available in the table below !
____________________________________________
Governance
This week in governance was relatively active with 1 proposals created, 1 queued and 2 executed. Those were related to :
Stay tuned for more insights next week ! If you have any data question don't hesitate to reach out to @naouufel on X/Twitter or to the Analytics General channel on our Discord.
____________________________________________
Notes
Supply & Market Capitalisation : positions : on-chain data (RPC) , prices : DefiLLama
FiRM & Governance : on-chain data (subgraph: inverse-governance-subgraph)
DOLA Feds : on-chain data (RPC)
Markets : prices: Coingecko ; CEX trades & volume: Coingecko ; DEX trades & volume: on-chain data
Liquidity Pools : positions : on-chain data (RPC) ; prices : DefiLLama
To process and analyze the data we make a heavy use of python scripts and SQL which rely on our in-house data analytics platform Inverse Watch.
The data presented in this article has been aggregated on a weekly basis and is combining multiple data sources listed below. It is presented for information purposes and does not constitute an investment advice.
This analysis was realized taking assumptions due to the quality of the historical data available for some token prices. For this reason, some historical values might deviate from the reality
We do strive to continuously improve our data productions processes and are upgrading our methodology every day with the best tools available. For this rreason the data might periodically get revised.