Analytics Weekly Highlights | 2025-W20


Hi Invader, and welcome to the Analytics Weekly Highlights for Week 20 of 2025.
____________________________________________
Supply & Market Capitalisation
In week 20 we observed a correction of the price and market capitalization :
INV FDV USD: 16,857,150 USD (-12.40%)
INV Circulating Supply USD: 16,327,853 (-12.36%)
INV Circulating: 595,690(+0.05%)
____________________________________________
DOLA Feds
DOLA Feds
This week the Fed Chair contracted the DOLA supply by more than 4 millions to accommodate FiRM markets :
Total DOLA Supply: 212,808,016 DOLA (-2.05%)
____________________________________________
FiRM
Usage
FiRM user numbers display no changes in week 20.
Borrowers: 98 (steady)
Stakers: 124 (steady)
Active Users: 206 (steady)
Markets
FiRM markets TVL and current borrows are displaying strength in week 20 due to large deposits (8.9 M) and borrows (7.2M) on the DOLA/USR market :
TVL : 98,657,517 USD (+1.51%)
Current Borrows : 69,749,010 DOLA (+5.91%)
This week we spotted many transactions above the 100k mark mainly on DOLA/USR, yvCurve-DOLA-sUSDe-f and deUSD/DOLA markets. To see the full list , scroll below this section.
DBR
This week the DBR burning mechanism has been very active this week with more than 1.8 millions DBR burned :
Burned: 1,597,314 DBR
Total Burned: 46,522,417 DBR (Change: +3.43%)
____________________________________________
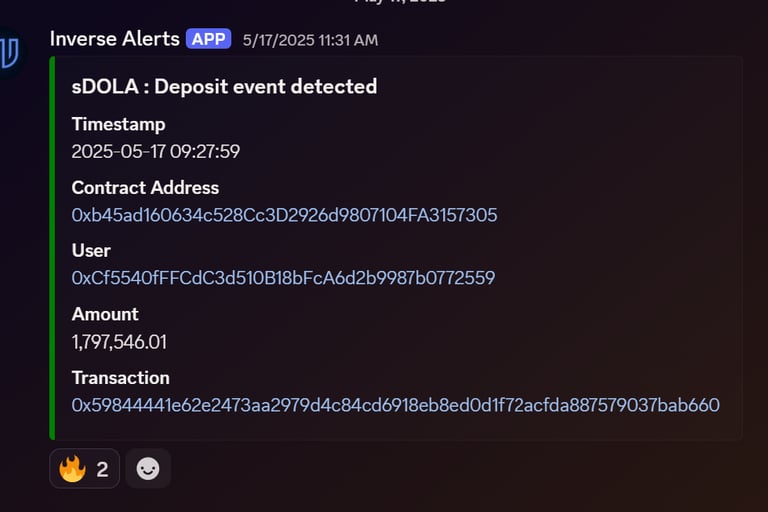
sDOLA
At the end of Week 20 sDOLA deposits aretheir unstoppable increase and reach 34 millions :
Total deposits : 34,417,025 DOLA (+14.11%)
This week also features the largest deposit on sDOLA contract ever with $DOLA 1.7 M deposited in a single transaction (See on etherscan)
____________________________________________
sINV
In Week 20 sINV deposits see a slight increase :
Total deposits : 34,402 INV (+1.84%)
____________________________________________
DBR Virtual Auction
This week the DBR auction was active :
Total DOLA bougth : 2,644,073 DOLA (+54,406 DOLA / +2.1%)
Total DBR sold : 30,064,523 DBR (+711,282 / +2.42%)
____________________________________________
DOLA Liquidity Pools
On the LP front, we observe a sharp increase in Other Assets :
DOLA in LPs: 39,228,476 DOLA (+0.12%)
Other Assets in LPs: 42,643,075 USD (+7,47%)
DOLA/Other Assets Ratio: 91.99% (Change: -1.29 pp)
The largest changes this week are observed on Ethereum Mainnet :
D0LA-USR curve lp TVL increases by USD 8.1 million (+45.36%) to USD 26 millions at week close
D0LA-sUSDs curve lp TVL decreases by USD 3.9 million (-20.56%) to USD 15.2 millions at week close
D0LA-deUSD curve lp TVL decreases by USD 0.9 million (-11.07%) to USD 7.5 millions at week close
More exhaustive figures available in the table below !
____________________________________________
Governance
This week in governance was quiet with only 1 proposals created and queued related to Re-allocate the FiRM Market Ceilings for DOLA/USR LP
Stay tuned for more insights next week ! If you have any data question don't hesitate to reach out to @naouufel on X/Twitter or to the Analytics General channel on our Discord.
____________________________________________
Notes
Supply & Market Capitalisation : positions : on-chain data (RPC) , prices : DefiLLama
FiRM & Governance : on-chain data (subgraph: inverse-governance-subgraph)
DOLA Feds : on-chain data (RPC)
Markets : prices: Coingecko ; CEX trades & volume: Coingecko ; DEX trades & volume: on-chain data
Liquidity Pools : positions : on-chain data (RPC) ; prices : DefiLLama
To process and analyze the data we make a heavy use of python scripts and SQL which rely on our in-house data analytics platform Inverse Watch.
The data presented in this article has been aggregated on a weekly basis and is combining multiple data sources listed below. It is presented for information purposes and does not constitute an investment advice.
This analysis was realized taking assumptions due to the quality of the historical data available for some token prices. For this reason, some historical values might deviate from the reality
We do strive to continuously improve our data productions processes and are upgrading our methodology every day with the best tools available. For this rreason the data might periodically get revised.