Fetching Data from The Graph
TUTORIAL


Our platform integrates a light homemade GraphQL client. Let's have a look at how we can fetch our decicated subgraph endpoints using it : inverse-subgraph and inverse-governance-subgraph.
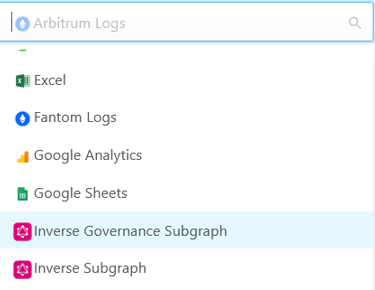
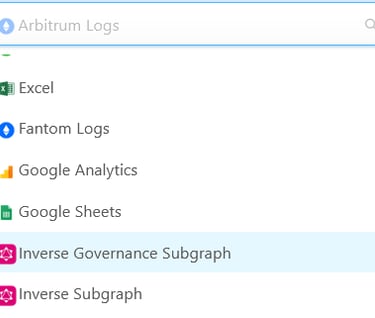
To start, head to your query editor and select the subgraph you want to use in the data sources.
Let's continue with "Inverse Governance Subgraph" our subgraph indexing FiRM events and governance data.
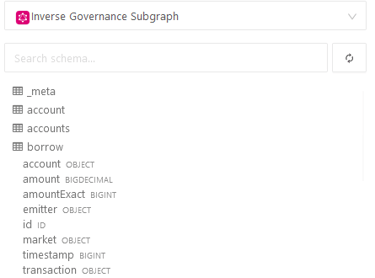
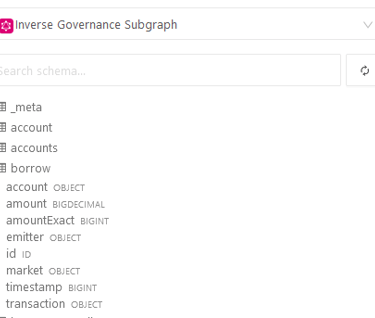
You're connected ! You will see the list of available entities and their dimensions in the schema panel on the left. Cool, let's get you to the serious stuff now.
In your query editor, type the following query :
query borrowEvents {
borrows(
first: $first,
skip: $skip,
orderBy: timestamp
orderDirection: desc
) {
timestamp
id
account {
id
}
emitter {
id
}
market {
id
}
transaction {
id
}
amount
}
}
This is a query in the GraphQL format. Let's break it down line by line :
query borrowEvents : is not important in this context , we are just telling the system what is the name of our query when ran against the endpoint ;
borrows : is a mandatory field, it tells your query the table you are fetching the data from
first and skip : are technical fields , they allow to paginate the result of the query and retrieve those where the data contains more than 1,000 rows of results, a limit fixed by the Graph. Do not amend them if you want to get all results from the endpoint.
orderBy and orderDirection : are self explanatory instructions to get the data in the desired shape
Finally we get the fields :
timestamp
id
account
emitter
market
transaction
amount
We can notice that some fields are referenced with their { id } between brackets. This is due to the way a subgraph indexes the data : a relational model allows more flexible web queries.
You can distinguish those dimensions using their types in the chema browser : they are from the 'OBJECT' type.
Now you have your query setted up, hit the 'Run Query' button and wait for the execution to complete. Retrieving the results should in principle be a matter of seconds but can take longer for large datasets.
You will notice that the app has automatically attributed a name to your table and columns : this is because in case of more complex query we might want to fetch data from several tables into the same query. Once you have your result in the main table, you can use them to produce visualizations.
For instance below, we produce a simple bar chart of the borrow transaction per amount (no other grouping) :
If you need to perform more advanced calculation to your data, like giving a date to the timestamp or give the amount a proper decimal, you might want to take a look at our doc : Querying Existing Query Results and use the result of the query we just designed as a data source using our SQLite client.
Have fun on inverse.watch !